Website Uptime & Monitoring Tools Every Online Business Needs in 2026
Compare 2026 uptime and website monitoring tools, pricing, features, and best-fit use cases for SMBs, agencies, and enterprises.
 Admin
Admin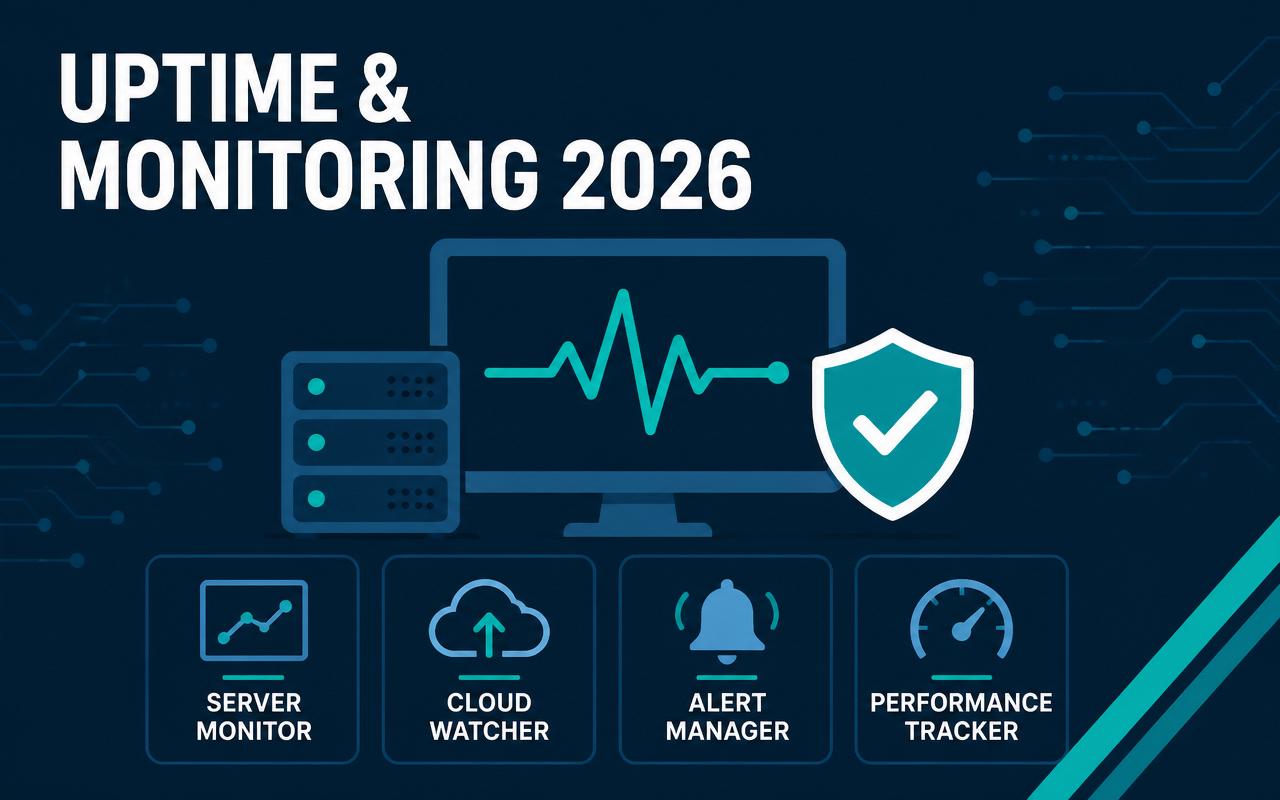
When a checkout page slows down, a login flow fails, or a DNS change takes the whole site offline, the damage starts before your team sees the alert. Customers leave, ad spend keeps running, and support gets flooded with tickets that all point to the same root cause. In 2026, uptime monitoring is no longer just about pinging a homepage once a minute. Online businesses need tools that check real user paths, confirm SSL and DNS health, warn on regional outages, and tell ops teams whether the problem is theirs or a vendor’s. The right stack makes those failures visible early enough to act before revenue, trust, and search rankings take the hit.
Why uptime and website monitoring tools matters in 2026
Monitoring now has to cover more than a single server or status code. Customer journeys depend on third-party scripts, CDNs, identity providers, and cloud infrastructure that can fail independently.
- Micro-outages are harder to see but still hurt conversions, especially on checkout, auth, and lead forms.
- Search engines and ad platforms reward stable performance, so repeated downtime can raise acquisition costs.
- Distributed teams need alerts that include location, region, and dependency context, not just a simple down/up signal.
- More businesses run multi-cloud and edge delivery, which adds more moving parts and more false positives if checks are misconfigured.
- Support teams now expect incident timelines, status pages, and postmortem evidence from the same platform.
- Regulated teams often need audit trails, uptime reports, and retention controls for internal reviews and vendor management.
The 10-12 uptime and website monitoring tools to watch in 2026
UptimeRobot
UptimeRobot is a practical choice for teams that want fast setup and broad coverage without building a full observability program. It works well for small sites, internal tools, and agencies that need to watch many endpoints from one dashboard. The appeal is not complexity; it is the ability to get meaningful alerts on HTTP(S), keyword, ping, port, and heartbeat checks with very little configuration. For teams with lean ops staffing, that simplicity often matters more than deep customization.
- HTTP(S), ping, port, keyword, and heartbeat monitoring
- Multi-location checks to reduce false positives
- Status pages and maintenance windows
- Basic SSL and domain monitoring
Starts around $7/month (verify current pricing). Best for small businesses, startups, and agencies that need reliable basics fast.
Pingdom
Pingdom remains a strong fit for teams that want uptime monitoring plus performance insight in one product. It is useful when you care about page speed and user experience, not only availability. That makes it a better fit than bare-bones ping tools for marketing sites, ecommerce storefronts, and customer portals where load time and uptime affect the same revenue path. Its reporting is easy to digest for non-technical stakeholders, which helps when ops needs to explain incidents to leadership.
- Synthetic uptime checks from multiple locations
- Page speed and transaction monitoring
- Public status pages
- Alerting through email, SMS, and integrations
Starts around $15/month (verify current pricing). Best for small to mid-market teams that want uptime and performance checks in one tool.
Better Stack (Better Uptime)
Better Stack combines uptime monitoring, incident response, status pages, and on-call workflows in a cleaner package than many legacy tools. It is especially useful for teams that want alerts to turn into action without stitching together several separate products. The platform is a good fit for SaaS companies that need fast escalation, friendly incident comms, and enough monitoring depth to cover APIs, jobs, and core web flows. It also tends to appeal to teams that want a modern UI without sacrificing practical ops features.
- Uptime checks with incident routing
- Built-in status pages
- On-call scheduling and escalation
- Heartbeat monitoring for jobs and cron
Starts around $29/month (verify current pricing). Best for SaaS teams, startups, and digital businesses that want monitoring and incident response together.
StatusCake
StatusCake is a flexible option for businesses that need a broad mix of monitoring types and a straightforward rollout. It covers uptime, page speed, server monitoring, domain, SSL, and more, which makes it useful for teams managing several properties at once. Agencies and MSPs often like it because the account structure can support multiple clients and because the feature set goes beyond simple uptime. It is a sensible middle ground for teams that outgrow free tools but do not need a heavyweight observability suite.
- Uptime, SSL, domain, and server monitoring
- Page speed testing
- Public status pages
- Alerting and maintenance mode controls
Starts around $24.49/month (verify current pricing). Best for agencies, MSPs, and multi-site operators.
Datadog Synthetics
Datadog Synthetics is built for teams that already live in Datadog or need monitoring tied closely to application telemetry. Its strength is not just checking whether a site responds, but validating journeys and connecting failures to logs, traces, and infrastructure signals. That gives engineering teams a better path from alert to root cause. It is especially valuable for mature product organizations that need end-to-end visibility across web apps, APIs, and backend services rather than isolated uptime data.
- Browser tests and API tests
- Real browser journey monitoring
- Tight linkage with Datadog observability data
- Global test locations and alerting
Starts around $5 per 1,000 synthetic tests (verify current pricing). Best for engineering-led teams and companies already standardized on Datadog.
New Relic
New Relic fits teams that want synthetic monitoring inside a broader observability stack. It is most useful when uptime is only one piece of the puzzle and the real need is understanding how frontend checks relate to backend latency, database pressure, or deployment changes. For operators who already use New Relic for APM or logs, adding synthetics can reduce tool sprawl and help teams keep a single view of performance, health, and incidents.
- Synthetics for APIs and browser flows
- APM, logs, and infrastructure correlation
- Dashboards and alerting
- Release and deployment visibility
Starts around $0.30/GB ingest equivalent for full platform usage or contact sales for pricing on larger plans; verify current pricing. Best for engineering teams that want observability and uptime in one platform.
Site24x7
Site24x7 is a broad monitoring platform that covers websites, servers, networks, applications, and cloud resources. That scope makes it attractive for IT teams that want to consolidate tools rather than run one app for uptime and another for infrastructure. It is a strong choice when the same people who manage your website also manage your servers, cloud services, and network equipment. The trade-off is breadth: you get a lot, but you need to spend time configuring it properly to avoid alert fatigue.
- Website and API monitoring
- Server, network, and cloud monitoring
- Application performance monitoring
- Status pages and alert routing
Starts around $9 per month (verify current pricing). Best for IT teams and SMBs that want a broad monitoring suite.
Checkly
Checkly is a strong fit for developer teams that want monitoring built around code, not only dashboards. It is particularly good for synthetic browser checks and API monitoring that can be managed like part of the delivery pipeline. That makes it useful when tests need to live in Git, be reviewed like code, and align with CI/CD workflows. Teams shipping frequently often prefer this model because the monitoring stays close to the app and can evolve as fast as the product does.
- Code-based synthetic monitoring
- Browser and API checks
- GitOps-style workflows
- Global execution and alerting
Starts around $10/month (verify current pricing). Best for product and platform teams that manage monitoring as code.
Freshping
Freshping is the simplest entry point in the Freshworks ecosystem for teams that need basic uptime checks and a public status page without a large spend. It is often used by small businesses, solo operators, and new SaaS teams that need to prove reliability without buying a full incident management stack. The advantage is ease of use; the limitation is that advanced workflows, deep analytics, and complex dependencies will eventually push larger teams to a more robust platform.
- Uptime checks and response time monitoring
- Public status pages
- Alerting via email and integrations
- Maintenance windows and incident notifications
Starts around $11.95/month (verify current pricing). Best for small businesses and early-stage teams that need a low-friction start.
Uptrends
Uptrends is a solid option for organizations that need comprehensive synthetic monitoring with a strong focus on global coverage. It works well for companies with customers in multiple regions because it can test availability and transactions from different geographies. The platform is also useful when you need deeper performance insight than a basic uptime tool provides. For businesses with customer-facing portals, ecommerce sites, or global SaaS apps, that extra location context can make incidents easier to interpret.
- Synthetic browser and API monitoring
- Global monitoring locations
- Transaction checks
- Alerting and reporting
Starts around $11.20/month (verify current pricing). Best for mid-market teams with international traffic and transaction monitoring needs.
Hyperping
Hyperping is built around the operational needs of modern product teams: uptime monitoring, simple status pages, and incident communication that does not feel bolted on. It is a good fit when you want something lighter than enterprise observability but more polished than a bare ping service. Teams that need to keep customers informed during incidents often value the clean status page and straightforward alerting more than deep diagnostics. It is especially practical for startups and SaaS businesses with small support teams.
- Uptime checks with alerts
- Status pages
- Incident updates and maintenance messages
- Multiple check locations
Starts around $10/month (verify current pricing). Best for startups and SaaS teams that want clean status communication.
AppDynamics
AppDynamics is usually chosen by larger organizations that need application performance management tied to business impact. It is not the lightest tool on this list, but it becomes valuable when uptime issues need to be understood in the context of transactions, tiers, and dependency chains. If your business has complex apps, several integration points, and a formal ops process, AppDynamics can help align infrastructure events with customer-facing failures. It is less about quick setup and more about depth and governance.
- Application performance monitoring
- Business transaction visibility
- Infrastructure and service dependency mapping
- Alerting and diagnostics
Contact sales for pricing. Best for enterprise teams with complex application estates and governance requirements.
Comparison table
| Tool | Starting price | Best for | Standout feature |
|---|---|---|---|
| UptimeRobot | Starts around $7/month (verify current pricing) | Small businesses and agencies | Fast setup with multi-location uptime checks |
| Pingdom | Starts around $15/month (verify current pricing) | Teams that want uptime plus performance | Page speed and transaction monitoring |
| Better Stack (Better Uptime) | Starts around $29/month (verify current pricing) | SaaS and startup ops teams | Monitoring plus incident response in one product |
| StatusCake | Starts around $24.49/month (verify current pricing) | Agencies and MSPs | Broad mix of uptime, SSL, domain, and server monitoring |
| Datadog Synthetics | Starts around $5 per 1,000 synthetic tests (verify current pricing) | Engineering-led teams | Browser/API tests tied to observability data |
| Site24x7 | Starts around $9/month (verify current pricing) | IT teams and SMBs | One platform for websites, servers, and networks |
| Checkly | Starts around $10/month (verify current pricing) | Developer teams | Monitoring as code for browser and API checks |
How to choose the right uptime and website monitoring tools
- Match the tool to the failure mode you care about most: whole-site outage, slow pages, broken transactions, expired SSL, or failed jobs.
- Check alert routing options carefully. If the tool cannot send the right signal to the right owner, it creates noise instead of action.
- Look at geographic coverage. If you sell nationally or internationally, a single-region check can miss a real outage.
- Review integrations with Slack, Teams, PagerDuty, Jira, ServiceNow, and your incident workflow before you buy.
- Decide whether you need status pages and customer communications built in or are happy to keep them separate.
- For regulated or distributed teams, confirm retention, access controls, audit logs, and data residency options before rollout.
Suggested stack by company size
Small business / low budget
If the team is small and the site is not technically complex, keep the stack simple. The goal is to learn about outages quickly and tell customers what is happening without adding admin overhead.
- UptimeRobot for core uptime checks
- Freshping for a simple status page
- Hyperping for incident communication
- Pingdom if you need a bit more performance insight
Mid-market or agency
Mid-market teams usually need better reporting, more endpoints, and cleaner escalation paths. Agencies also need multi-client visibility without turning monitoring into a full-time job.
- StatusCake for broad client coverage
- Better Stack for alerting and incident response
- Pingdom for performance-aware monitoring
- Site24x7 for teams that also watch infrastructure
Enterprise
Enterprise buyers should prioritize root-cause context, governance, and integration depth over simple uptime counts. At this scale, monitoring must support operations, compliance, and customer communication.
- Datadog Synthetics for application-level journey tests
- New Relic for observability correlation
- AppDynamics for transaction and business-impact analysis
- Uptrends for global synthetic coverage
Trends to watch in uptime and website monitoring tools for 2026
- Agentic alert routing that classifies incidents, opens the right ticket, and assigns the right owner without manual triage.
- Synthetic checks that validate login, search, checkout, and API authentication flows instead of only testing the homepage.
- Dependency-aware incident views that show CDN, DNS, auth, and third-party service failures on the same timeline.
- Status pages with richer customer messaging, including region-specific impact, workaround notes, and recovery progress.
- Monitoring-as-code workflows where checks are versioned in Git and reviewed through pull requests.
- Faster correlation between release events and monitoring anomalies so teams can spot regressions minutes after deployment.
I learned the hard way that the biggest monitoring mistake is overchecking the wrong thing. On one rollout, we monitored the homepage every minute from several regions, but we missed a broken login redirect that only affected signed-in users. The alerts were technically green while support was getting hammered. The fix was to add browser checks for the actual customer journey, lower the tolerance for failed auth flows, and separate infra alerts from product-flow alerts. That change reduced false confidence more than any dashboard tweak ever did.
FAQs
What is the difference between uptime monitoring and website monitoring?
Uptime monitoring checks whether a site or endpoint responds. Website monitoring is broader and can include page speed, transactions, SSL, DNS, APIs, and user flows.
Do small businesses really need synthetic monitoring?
Yes, if revenue depends on a form, login, booking flow, or checkout. A simple uptime check can miss a broken customer journey.
Should I choose a standalone tool or an observability platform?
Choose standalone monitoring if you mainly need alerts and status pages. Choose observability if you also need logs, traces, infrastructure, and root-cause analysis in one place.
How many locations should uptime checks run from?
Enough to match your customer base. For local businesses, a few regions may be enough. For national or global apps, use multiple regions to catch path-specific outages.
What features matter most for agencies managing multiple clients?
Multi-tenant organization, flexible alerting, public status pages, maintenance windows, and simple report exports matter most for agencies. Those features keep client monitoring from becoming messy.
If you are choosing tools for 2026, start with the failure mode that hurts your business most, not with the longest feature list. A small ecommerce site may only need one solid uptime platform, a status page, and transaction checks. A SaaS company may need synthetic browser tests and incident response. An enterprise may need observability plus governance. Shortlist two or three tools, test them against your real customer journeys, and verify how they alert during an actual maintenance window before you commit.
Pricing sources
All prices cited in this article are taken from each vendor's official pricing page. Vendors update pricing frequently — always confirm the current rate with the source before purchasing.
Related articles
No-Code App Builders: The Best Platforms for Non-Developers in 2026
Compare the best no-code app builders for 2026 by use case, pricing, and real operational trade-offs for non-developers.
Admin
DevOps Toolchains in 2026: Building a CI/CD Stack That Scales
Build a scalable CI/CD toolchain in 2026 with practical guidance on GitHub Actions, GitLab, Argo CD, Terraform, Kubernetes, and more.
Admin
Cloud Storage & File-Sharing Platforms Compared: Which One Fits Your Team in 2026?
Compare 12 cloud storage and file-sharing platforms for 2026, with pricing, use cases, selection criteria, and stack recommendations.
Admin